NFLX Case Study – June 2013
Summary
Tradelegs was used to investigate different ways of expressing a bi-modal outlook on Netflix. The result would have been 195% more profitable than the analyst’s long equity Reference Strategy on a marked-to-market basis, while reducing the potential worst-case loss by 50%.
Note that the strategy generated using Tradelegs was not executed, but was backtested on the same basis as the original reference strategy.
Background
- NFLX – Netflix Corporation
- Trade Date: Jan 18th 2013 / Target Date: June 22nd 2013
- Predictions on the street for Netflix in Jan 2013 vary widely. Some think that it did irreparable damage to its brand by temporarily separating streaming from DVD rental, while others are optimistic about the new original content strategy that was planned
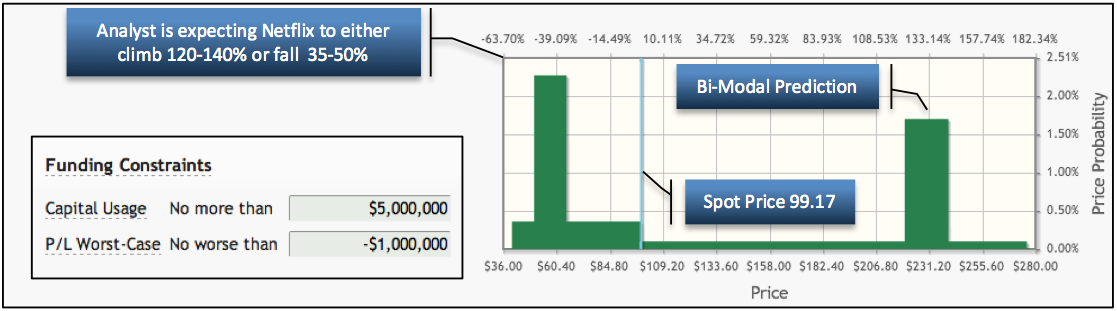
- The analyst investigates a bimodal view where if NFLX original programming fails, Netflix drops by ~50%, but if it succeeds, it returns to mid-2011 levels
Analyst Prediction and Constraints
Case Study Results
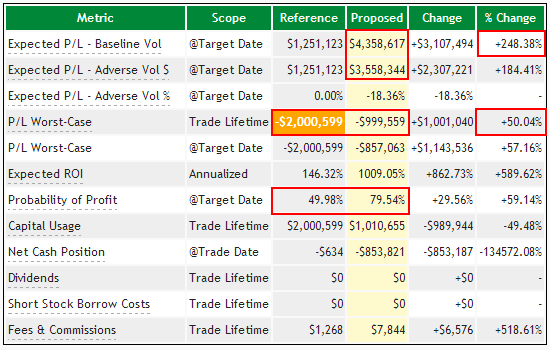
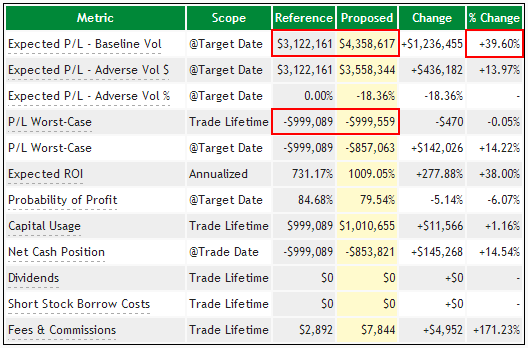
Expected Returns on Trade Date (Jan 2013)
- The Tradelegs Proposed Strategy is expected to outperform the Reference position on average by 248% while reducing the worst-case loss by 50%
- The Tradelegs Strategy meets the P/L Worst Case constraint of $1mm, unlike the Reference Strategy
- The Proposed Strategy dramatically outperforms the Reference under normal and adverse volatility
- The Tradelegs Strategy almost doubles expected probability of profit compared with an equity position
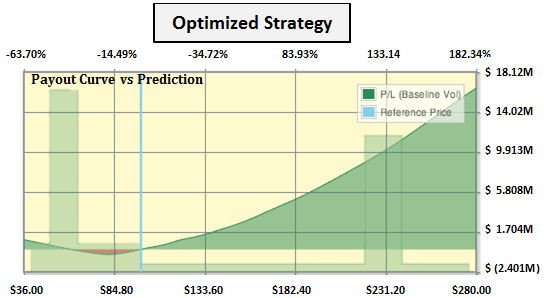
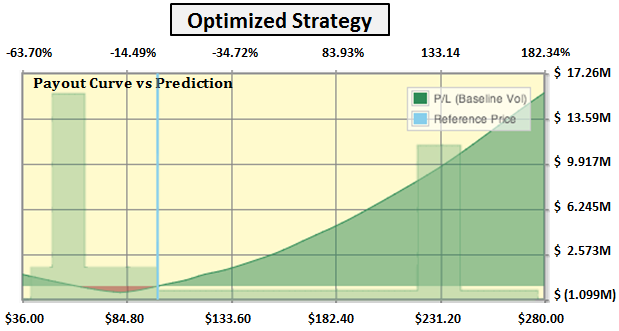
P&L Payout Curves
Optimized Strategy
- Protects the downside
- More accelerated upside
- Overlays with prediction more precisely
|
|
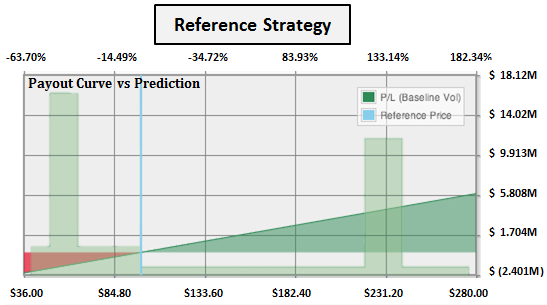
Reference Strategy
- Loses money on downside outcome
- Anemic returns on the upside
- Potential for larger losses
|
|
Case Study Conclusions
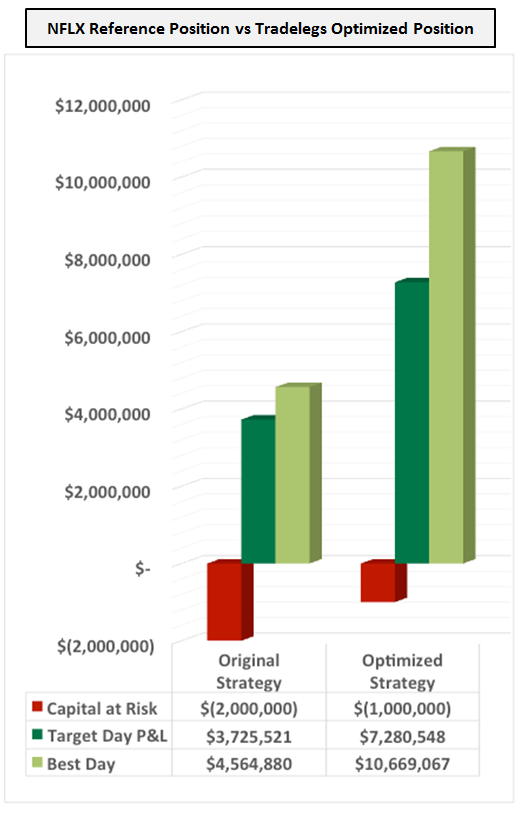 |
Actual Backtest Results (June 2013)
- The positions were marked-to-market each day until the Target Date
- The Tradelegs Optimized Strategy outperformed the analyst’s Reference Strategy by 195% on the Target Date
- On the best day for the trade (May 15th) the Optimized Strategy outperformed the Reference Strategy by 233%
- Throughout the life of the trade the Tradelegs Strategy outperformed the analyst’s Reference Trade on 105 of the 108 days while also protecting the downside risk
- Whether you are an occasional options trader or an experienced options strategist, Tradelegs’ advanced decision-support technology can give you a substantial edge over trading unaided
|
NFLX Case Study Part 2: Standard Options Spread Reference Strategy
Summary
The Tradelegs Optimized Strategy was also compared with a standard strangle spread as the Reference.
Case Study Results
Expected Returns on Trade
Date (Jan 2013)
- The Tradelegs Proposed Strategy is expected to outperform the strangle by 40%
|
|
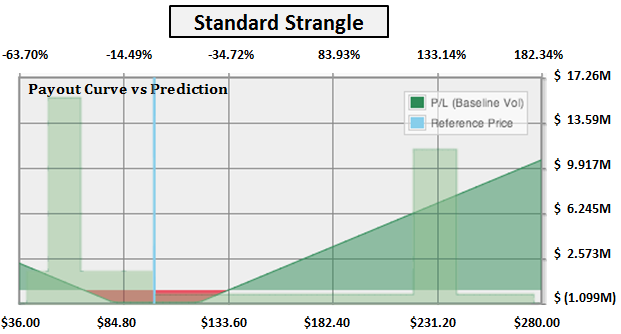
P&L Payout Curves
Optimized Strategy
- Protects the downside outcome and achieves a profit at and above spot
- More accelerated profit curve on the upside
|
|
Standard Strangle
- Protects the downside, but requires significant price movement before it becomes profitable
- Doesn’t achieve the same upward slope as the Tradelegs Optimized Strategy
|
|
 |
Case Study Conclusions
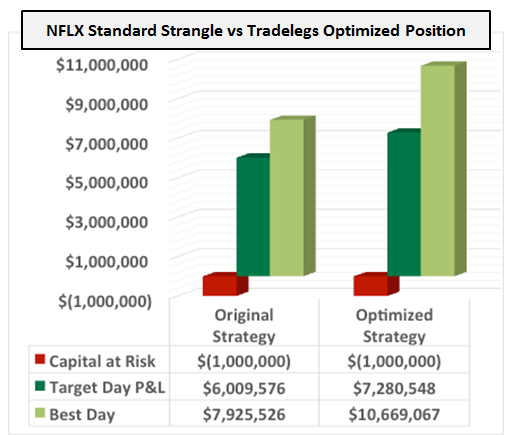
Actual Backtest Results (June 2013)
- The positions were marked-to-market each day until the Target Date
- The Tradelegs Optimized Strategy outperformed the Strangle by 21% on the Target Date
- On the best day for the trade (May 15th) the Optimized Strategy outperformed the Strangle by 35%
- This shows that the Tradelegs Strategy can generate more profit with less risk than a standard strategy
|